Introduction
The relationship between wealth and democracy has always been uneasy. In principle, democracy rests on political equality, the idea that each citizen’s voice carries equal weight. In practice, vast wealth inequality has created parallel economies of influence. Obscene wealth increasingly dictates who is heard, what issues are prioritised, and whose interests shape policy decisions. These concerns are not new; classic studies have examined how economic inequalities translate into political inequalities.
Yet despite these alarms, the problem has only deepened. Since the turn of the 21st century, inequality in the UK has rapidly accelerated, overwhelmingly to the benefit of the ultra-rich: the UK’s 156 billionaires now hold £619.5 billion.
Our analysis shows that over this period extreme wealth concentration has hardened into political concentration, as unelected influence has risen sharply over the past twenty years, reshaping the balance between wealth and democracy in the UK.
Large political donations, unelected appointments to the House of Lords, and consolidated media ownership have become conduits through which wealth converts into political authority. The result is a feedback loop: wealth buys access, access shapes policy choices, and policy protects an economic system that allows the obscene accumulation of wealth. As this loop tightens, ordinary people not only lose economic ground, but the political agency to effect change.
Britain’s centres of power are drifting further from public accountability and closer to private wealth. The outcome is an economy and polity that is responsive only to a narrow set of elite financial interests, rather than to the broad public. In practical terms, this looks like policy blind spots on low real wages, housing affordability, and fragile public services.

Contents
Key Findings
- A twenty-year rise in unelected influence: Our Concentration of Power Index tracks the alignment of party capture, media control, and unelected appointments between 2001 and 2022. Looking at its components: membership of the House of Lords has increased from an average of 676 members in 2001-2003 to 803 members in 2020-2022; large political donations (of more than £250k) rose from £7.6m in 2002 to more than £47m in 2019; the media share of the top three conglomerates rose from 71% in 2014 when the data series began, to 90% in 2022. The Concentration of Power Index synthesises the trends in these key variables into a simple metric, which shows a marked increase and entrenchment in the political influence of the ultra-rich and powerful over the past two decades.
- Wealth concentration moves in step with unelected influence: The Concentration of Power Index rises almost exactly in step with increases in the top 1% share of wealth. As the ultra-rich grow richer, political influence, authority, and power increasingly aligns with them.
- Wealth, not income, is the main driver: The correlation between political influence and wealth inequality (particularly the top 1% share) is strong and statistically significant, while the same is not true for income inequality. Wealth accumulation, rather than wages, is the more relevant driver of the concentration of power.
- Outsized influence is now cemented control: Despite repeated public alarms, the overall trajectory shows no signs of reversing. Britain’s democratic architecture has become more susceptible to unelected influence, now hardening into systemic dominance, while countervailing forces such as trade unions, local journalism, and civic organisations have weakened.
Methodology
Index Construction
To capture the scale and trajectory of unelected influence, we developed a Concentration of Power Index drawing on three empirical sources of data: appointments to the House of Lords, large political donations, and media ownership concentration. Each strand is standardised and equally weighted in the Index.
The index tracks relative change between 2001 and 2022, providing an accessible metric that can be used to see how wealth inequality and political power have become increasingly intertwined. It is a composite of the three standardised component series (z-scores). For 2001–2013 it averages two of these measures (House of Lords eligible membership and large-donor capture defined as ≥250k). From 2014, it averages all three measures (adding in media concentration) as our source for reliable media ownership data began from that year.
Relationships between the Index and wealth inequality were tested using the share of wealth held by the top 10% and top 1% respectively (Wealth P90/10 and Wealth P99/100 ratios). Relationships between the Index and income inequality were tested using five different measures of income inequality: the ratio of the total income received by the richest 20% of the population to the total income received by the poorest 20% (S80S20 ratio); the ratio of the total income received by the richest 10% to the total income received by the poorest 90%( S90S10 ratio); the Palma ratio; the top 1% income share, and the Gini coefficient.
Data Sources
| Component | Data Source | Notes |
|---|---|---|
Eligible membership of House of Lords | House of Lords Library | Values represent the count of members “eligible to sit” at a fixed point each year |
| Total amount of donations to major political parties ≥ 250,000 GBP | Electoral Commission donations register | After parsing, aggregated donor-year totals and measured the total sum totals that were ≥ £250,000 (large donations) in a calendar year, then used that annual total as the party capture series; excluded in-kind donations. Data includes donations to Conservatives, Labour, and Liberal Democrats. |
| Share of national newspaper circulation owned by top 3 conglomerates | Media Reform Coalition Annual Reports | |
| Top 1% and Top 10% net personal wealth share | World Inequality Database, United Kingdom | |
| S80S20 ratio, S90S10 ratio, Palma ratio, Top 1% income share, Gini coefficient | ONS Data Household income inequality, UK: financial year ending 2024 | Equivalised disposable income, all people, UK ONS data estimates of income inequality from FYE 2002 onwards have been adjusted for the under-coverage of top earners. |
Limitations
The index is a concise, reproducible measure that aggregates independent strands of influence into a single accessible metric.
Permissive substring mapping can misclassify some entities in the Electoral Commission register (e.g. local associations, trusts). Further fuzzy matching and entity reconciliation would improve precision. UK donation reporting rules and party accounting practices have changed over time, so reporting completeness and format vary by year. Dark money or unreported donations are not captured in our index. No sensitivity tests were run on donor thresholds, meaning small adjustments to alternative cut-offs could alter some values, though the direction of effect is unlikely to change.
Data for the Top 0.01% net personal wealth share was not readily available for our analyses, but further research focusing on this share would further improve insights. Lag tests for wealth inequality were not performed, but future work could explore these shifts and changes.
For further information please see the Technical Appendix.
Concentration of Power Index
The Concentration of Power Index combines three key channels of unelected influence: appointments to the House of Lords, media ownership, and party donations, into one composite metric, showing how they have increased over the past two decades. There is ultimately a sustained strengthening of moneyed influence across these channels.

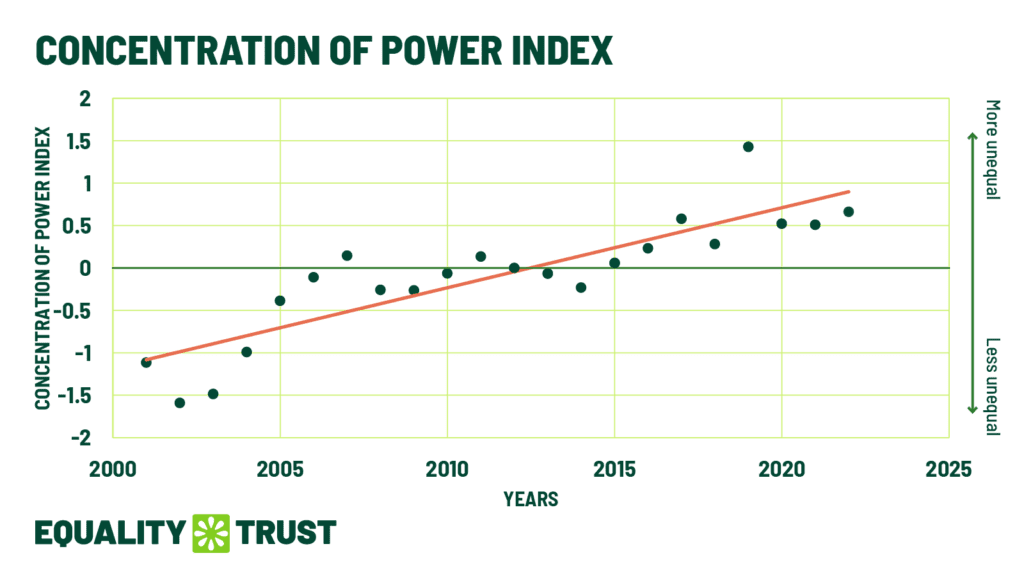
Figure 1 tracks the change in the concentration of power over time. The index climbed steadily from 2001 to 2022. This represents a structural recentring of influence by the wealthy elite: what used to appear as exceptional episodes of lobbying expenditure, media bias, or patronage appointments now defines the normal operating environment of British democracy.

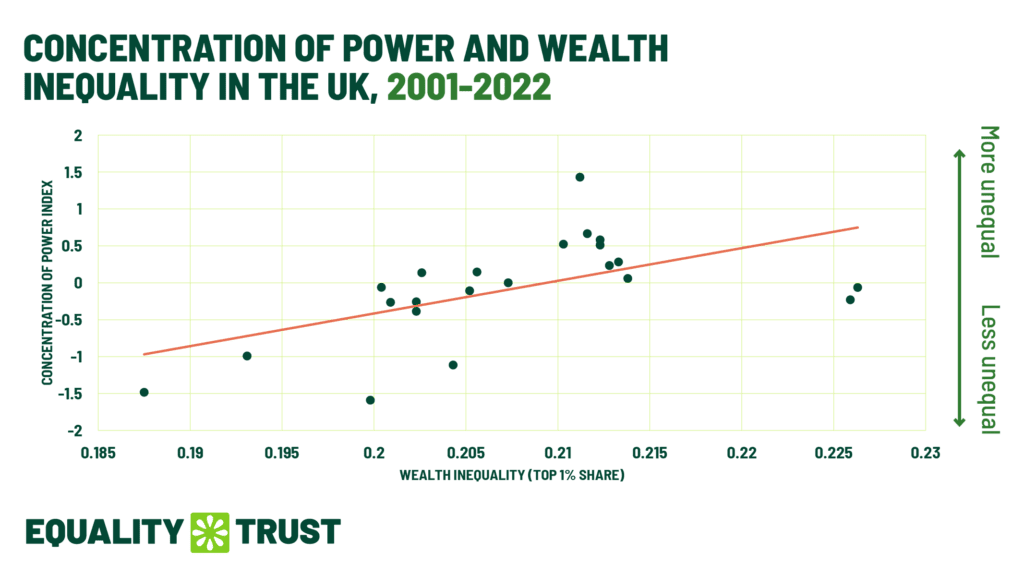
Figure 2 reveals how this consolidation of power and unelected influence aligns with wealth concentration. The share of national wealth held by the top 1% is strongly and significantly correlated with the Concentration of Power Index. Years in which the wealthiest 1% hold even more also tend to be years when unelected influence is higher, and this relationship remains robust even after outliers are removed.
By contrast, income inequality is not strongly correlated with the Concentration of Power Index – a weak positive association is seen only with the Top 1% Income Share – suggesting that wealth, not income, is the prime engine of political inequality and that tackling obscene wealth remains the major policy priority. It is also the case that income inequality has fluctuated only modestly since the 1990s, while wealth inequality has surged, and with it the capacity to shape policy.
Together, these findings reveal more than just a rise in material wealth accumulation. They show how the architecture that allows concentrated wealth to influence politics has grown stronger and more aligned since the turn of the century, moving from transactional to structural. Despite alarm bells ringing for decades after the massive rise of inequality under Thatcher, there is no sign of this trend reversing, shrinking, or being undone. What was once outsized influence has ballooned into cemented control. Wealth does not merely buy access, but is firmly woven into the fabric of governance.
What is Considered Corruption?
Corruption is often imagined as an exchange of money for favour, resulting in outright illegal and criminal wrongdoing. A deeper examination of corruption requires us to consider a more enduring form, where corruption is structural. This legal, but equally damaging, operation moves through the routine circulation of wealth accumulation, access, and favour. Institutions adapt to be more responsive to and serve concentrated wealth, rather than the needs of ordinary residents. With this understanding, the UK is exhibiting a slow-moving, legalistic form of corruption. Party donations are dominated by a handful of financiers, all major newspapers are now owned by only three conglomerates, and the upper legislature is unelected and swelling.
In the sections that follow, we examine how each of the examined strands functions as a conduit for unelected power, authority, and influence. Political finance reveals how parties and politicians can become structurally indebted to donors, media ownership demonstrates how concentrated wealth controls narrative formation and public agenda-setting, and appointments to the House of Lords expose the persistence of patronage in a supposedly meritocratic democracy. These are not aberrations but outcomes of an economic system that rewards accumulation and enables its holders to shape the very rules of that system. Understanding these mechanisms is essential to confronting that the deeper corruption of democratic equality is indeed wealth inequality.
The examined levers also requires us to ask ourselves why we maintain and reproduce an economic system where capital is unflinchingly allowed to be translated into political and cultural capital. Other economic and political practices, across geography and history, have resisted this dynamic. Among Indigenous nations of the Pacific Northwest, for example the Wendat (Huron) people, the accumulation of wealth was offset by the potlatch system.1 This redistribution prevented material wealth from translating into enduring power. Britain, by contrast, has moved in the opposite direction by institutionalising pathways through which wealth consolidates and perpetuates itself to outlast us.2
Unelected Appointments
With nearly 800 eligible sitting members, the UK currently has the second-largest legislative chamber in the world, surpassed only by China’s National People’s Congress (with a comparative population of over one billion). Despite a sharp reduction prior to the 2000s, it has again ballooned from an average of 676 members between 2001 and 2003 to an average of 803 members between 2020 and 2022. There is no upper limit on its size, and every new batch of appointments raises questions around patronage and party reward.
In Britain’s unusual system of Upper House selection, money doesn’t just buy access to legislators but goes further so that donors themselves can become the legislators. Financial support for parties translates into life peerages, granting unelected individuals enduring legislative power. The effect is cumulative, with a chamber increasingly shaped by the wealthy few rather than the electorate at large. Indeed, when the ‘usual suspects’ for a position, like former MPs and party workers, are accounted for, donations play an outsize role in accounting for the remaining peers.3 Essentially, Britain’s Upper house is vulnerable to, and is being sold to, wealthy donors who hold power to revise and delay crucial legislative changes.
Political Party Capture
Political finance data reveal how Britain’s major parties have become structurally indebted to a narrow pool of wealthy donors. Between 2001 and 2010, just a few hundred large gifts (from less than 60 sources and each exceeding £250,000) accounted for around 40 % of all declared funding received by the Conservative, Labour, and Liberal Democrat parties.4
By 2019, 60% of all party donations came from individuals rather than organisations.5 Nearly half were provided by super-donors contributing over £100,000 or more in a single year.6 This means the funding base has narrowed even as disclosure rules have improved, leaving parties increasingly reliant on a handful of wealthy benefactors.
This dependency skews responsiveness, as parties become accountable to funders rather than voters. The UK remains one of only six countries worldwide that imposes caps on campaign spending but not on donations.7 Corporate–political links further blur the line between support and reward: since 2000, “giver-and-taker” companies have donated £47 million to major parties and received contracts worth over £1,294 for every £1 donated, with nearly one in ten securing a major contract within two years of their gift.8
Media Oligopoly
The national press has become sharply more concentrated. Although the press should function as an open forum of ideas, Britain now has a media ecosystem where a few private empires act as both gatekeepers and participants in political life. In 2014, three conglomerates—Rupert Murdoch’s News UK, Lord Rothermere’s DMG Media (Daily Mail Group), and Reach plc (Mirror, Express and Star)—already dominated, controlling about 71% of national daily circulation. By 2019, following further takeovers, their share had risen to 83%; by 2022, to roughly 90%. That 20 percentage-point climb in less than a decade represents the steepest consolidation in modern British media history.
This is an oligopoly dominated by a small number of owners, dubbed ‘the billionaire press’, whose financial and policy interests extend well beyond journalism. The national press remains a primary vehicle for shaping public opinion and framing policy debate, but when this control narrows, so does legislative decision-making that requires a plurality of viewpoints. Content analyses show that dominant owners, especially Murdoch, have exploited their outlets to promote ideological positions (mainly right-wing political parties and leaders), promote his own corporate and commercial interests, and attack institutional rivals and regulators.9 This circularity means that British media shapes the opinions that in turn shape the policies from which billionaire owners benefit.
Drivers of Wealth Inequality
Our analysis shows that the consolidation of political influence tracks closely with wealth inequality.
The wealthy hold their assets in pensions, property, and financial markets that have expanded far faster than wages. In the UK, workers are enduring the longest pay squeeze in over 200 years, while billionaire fortunes grow by US$2.7 billion per day.10 11Since the 1960s, around 60% of total economic growth has gone to the top 1%, and since 1980, the top 10% have more than doubled their share of national wealth, while real earnings have largely stalled.
This concentration is fuelled by asset inflation and financialisation: the steady rise in property and equity values disproportionately benefits those who already own them. Privatisation and deregulation have further deepened the divide, converting public goods into private assets and multiplying the stakes of political influence. Weak tax regimes, inheritance loopholes, and property have entrenched intergenerational advantage. Wealthy individuals and corporations not only have more to protect but more means to influence how that protection is legislated. Their wealth now functions as both the engine and the shield of inequality, generating returns that protect itself while hollowing out the institutions, from unions to local journalism, that once kept economic power in check.
POLICY RECOMMENDATIONS
The capacity of wealth to shape policy has grown stronger and more interconnected, challenging the assumption that democratic institutions alone can counterbalance the harms of wealth inequality. Despite huge holes in public finances, not enough is being done to tax wealth, and discussions around wealth taxes must continue to be on the table. Other safeguards, reinvestments, and modernised political processes must be implemented to encourage and ensure participative policymaking.
- Introduce a progressive wealth tax and close high‑end loopholes: Implement a 2% annual tax on net assets above £10 million, rising to 5% for billionaire fortunes. Only 0.04% of households would pay, yet revenues of roughly £24 billion could be secured for public services. This should be complemented with (i) tighter stamp duty rules on high‑frequency share trades and (ii) a levy on share buybacks, together worth another £4.4 billion. Polling shows 72% of the public support taxing extreme wealth as a targeted measure that puts responsibility on those who can best afford them.
- Prohibit large private donations outright: Donations above a modest ceiling (e.g. £5,000 annually per individual) should be banned, closing loopholes that allow wealthy donors to fragment contributions through family members, shell entities, or corporate vehicles
- Create co-production mechanisms: Build systems where communities can actively participate in identifying problems, creating solutions, and holding people accountable
- Establish an International Panel on Inequality: As recommended by the G20 Extraordinary Committee of Independent Experts on Global Inequality, to monitor global trends, analyse the drivers and consequences of inequality, and evaluate policy options to inform governments, policymakers and the international community
- Put limits on political appointments and patronage: Reform the House of Lords and related appointment systems to reduce the exchange between financial contribution and political access, and encourage merit-based or electoral processes to reduce patronage. Former ministers, donors, and lobbyists should face extended cooling-off periods before holding party or parliamentary influence positions.
- Create mass media safeguards: Encourage ownership diversity and invest in and fund independent local media to dilute the dominance of a few large actors
- Rebuild and invest in civic capacity: Expand funding for civic space, unions, and community organisations that broaden representation in policymaking processes
- Support civic media and investigative journalism: These scrutinise political spending and lobbying, bolstering democratic oversight beyond formal regulation.
Technical Appendix
Table A: Correlations and statistical significant for Wealth inequality (Top 1 %) and Concentration of Power Index, 2001–2022
| Statistic | Correlation coefficient (r) | Statistical Significance (p-value) | Interpretation | Notes |
|---|---|---|---|---|
| Pearson correlation | 0.564 | 0.0062 | Moderate positive; statistically significant | |
| Spearman rank correlation | 0.621 | 0.0020 | Strong positive; statistically significant | Confirms robustness of pattern |
| Cook’s distance | Obs 13 = 0.412 Obs 14 = 0.545 | Two influential years (very high wealth shares) pull regression line downward | Removing them increases r → 0.783 (R² → 0.612) | |
| Adjusted (robust) Pearson (after excluding obs 13 and 14) | 0.783 | <0.0001 | Strong positive;highly significant | Confirms relationship is not driven by outliers |
For this report, wealth inequality is measured through the P99/100 ratios. The correlation between the Top 1 % share of wealth and unelected influence is moderate to strong, and statistically significant (p < 0.01). The relationship strengthens further once high-leverage years are removed, indicating that the link between wealth concentration and power concentration is both robust and consistent across the period 2001–2022.
For further information please contact info@equalitytrust.org.uk
Media Coverage
- Wengrow, D. and Graeber, D. (2021). The Dawn of Everything. Farrar, Straus and Giroux. ↩︎
- Gauhar, A. (2025) Hard work or inherited (mis)fortune? Young People’s Future in an unequal world, LSE Inequalities Blog. ↩︎
- Radford, S., Mell, A. and Thevoz, S.A. (2019). ”Lordy me!” Can donations buy you a British peerage? A study in the link between party political funding and peerage nominations, 2005–2014’, British Politics, 15(2), pp. 135–159. ↩︎
- Wilks-Heeg , S. (2010). ‘Just 224 large donations from fewer than 60 sources accounted for two fifths of the donation income of the top three parties across a decade of British politics ’, LSE Inequalities Blog. London School of Economics , 30 November. ↩︎
- Draca, M., Green, C. and Homroy, S. (2022) Financing UK Democracy: A Stocktake of 20 Years of Political Donations Disclosure. CAGE working paper no. 642 ↩︎
- Ibid ↩︎
- Ibid ↩︎
- Givers and Takers: uncovering the donor-contractor nexus at the heart of government – The Autonomy Institute ↩︎
- Langworth, R. (2020). Media ownership and the exploitation of media power for corporate self-interest. Westminster Research, University of Westminster. ↩︎
- Christensen, M. et al., “Survival of the Richest: How We Must Tax the Super-rich Now to Fight Inequality” Oxfam, January 2023 ↩︎
- Pay Packets Worth Less Than 2008 in Nearly Two-Thirds of UK Local Authorities”. Trade Union Congress, April 2024. ↩︎
