The Scale of Economic Inequality in the UK
Find out more about inequality
The UK has very high inequality of income compared to other developed countries; the 9th most unequal incomes of 38 OECD countries (OECD, 2022).
The UK’s wealth inequality is much more severe than income inequality, with the top fifth taking 36% of the country’s income and 63% of the country’s wealth, while the bottom fifth have only 8% of the income and only 0.5% of the wealth according to the Office for National Statistics.
Inequality of wealth and income fell during the 20th century, but began rising again in the 1980s.
9TH MOST UNEQUAL incomes
in the OECD
top fifth own two thirds of wealth
and 36% of the UK’s income
bottom fifth own 0.5% of wealth
and 9% of the UK’s income
UK Income Inequality
The UK has a very high level of income inequality compared to other developed countries.
The majority of households in the UK have disposable incomes below the mean income (£32,300 as of 2022). This includes wages and cash benefits, and is after direct taxes like income tax and council tax, but not indirect taxes like VAT. The median income was rising by 2.2% on average for the last five years before the pandemic. However, in 2022, incomes for the poorest 14 million people fell by 7.5%, whilst incomes for the richest fifth saw a 7.8% increase.1
In 2022, households in the bottom 20% of the population had on average an equivalised disposable income of £13,218, whilst the top 20% had £83,687. As can be seen from the graph below when original incomes are compared, the difference is even more striking: the richest fifth had an income more than 12 times the amount earned by the poorest fifth.2
Differences Within the Top 1%
The graph above does not show the full extent of the difference between the richest and the rest of society. This is because the top 1% have incomes substantially higher than the rest of those in the top 10%. Since 1980, the share of income earned by the top 1% in the UK has generally been rising, peaking at 14.7% in 2007 before the financial crisis. This is almost double the corresponding figure for Belgium (7%) and still higher than Australia (9%), Sweden (8%) and Norway (8%), to name a few. For the whole world, the top 1% earn 20% of the total income.3 Depending on method calculation, the top 1%’s share of net household income rose to a new high in 2019 and continued to increase.4
How Income is Shared
The graph below shows how disposable income is shared amongst households. The poorest fifth of society has only 8% of the total income, whereas the top fifth has 36%.
Disposable income share by quintile group for financial year ending 2021, ONS

Source: ONS Chancel and Piketty (2021), in the World Inequality Report 2022
The redistributive effect of taxes and benefits is felt most significantly in retired households, where disposable income inequality is lower than non-retired households. Retired households’ Gini for disposable income is 28.5%, whereas for non-retired households this figure is 32.8%.5 Most of the increase in retired households’ income since end-1970s has to do with the seven-fold rise in private pension income in this period.6
UK wealth Inequality
Wealth in Great Britain is even more unequally divided than income. In 2020, the ONS calculated that the richest 10% of households hold 43% of all wealth. The poorest 50%, by contrast, own just 9%.7 More than that, for the UK as a whole, the WID found that the top 0.1% had share of total wealth double between 1984 and 2013, reaching 9%. Worldwide, the top 0.01% owned 11% of the global wealth by 2021, part of the trend towards a massive increase in wealth for billionaires.

Source: The Office for National Statistics – Wealth and Assets Survey, 2022
The graph below shows how wealth distribution has changed since the last century for the top 10%, who have consistently held the majority of wealth.
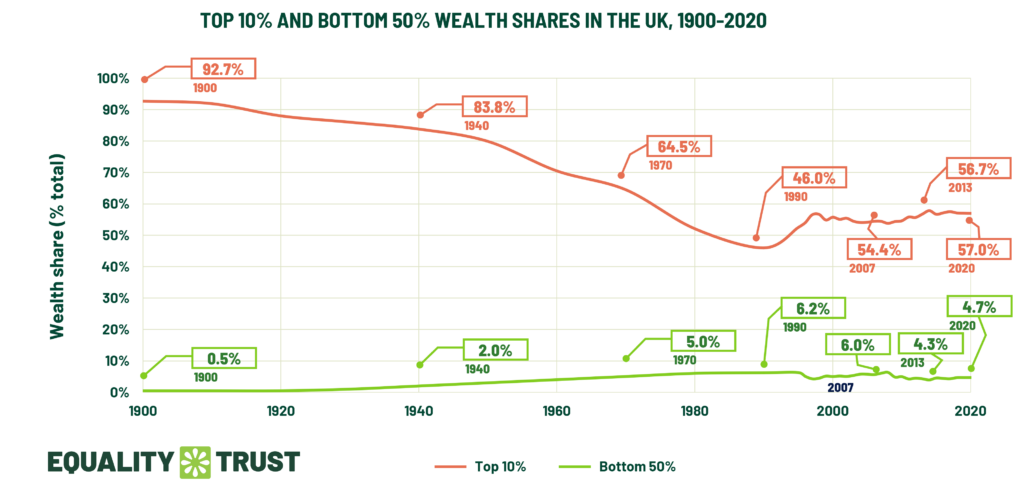
Source: ONS Chancel and Piketty (2021), in the World Inequality Report 2022
By 2023, the richest 50 families in the UK held more wealth than half of the UK population, comprising 34.1 million people. If the wealth of the super rich continues to grow at the rate it has been, by 2035, the wealth of the richest 200 families will be larger than the whole UK GDP.
£466 billion
Wealth of the richest 50 families in the UK
£466 billion
The combined wealth of half of the UK population
Source: Analysis by Ben Tippet and Rafael Wildaur, University of Greenwich
Wealth Spread Between Great Britain’s Regions and Nations
Wealth is also unevenly spread across Great Britain. The South East is the wealthiest of all regions with median household total wealth of £503,400, over twice the amount of wealth in households in the North of England. Much of this wealth imbalance is driven by property wealth, as shown by the graph of aggregate wealth below.

Median household wealth by region for 2018-20, ONS: Wealth and Assets Survey, 2022

Aggregate household wealth by region for 2014-16, ONS: Wealth and Assets Survey, 2018
GLOBAL WEALTH AND INCOME INEQUALITY
The UK’s wealth distribution is roughly average compared to the other OECD countries. The UK has a wealth GINI coefficient of 74.6%.
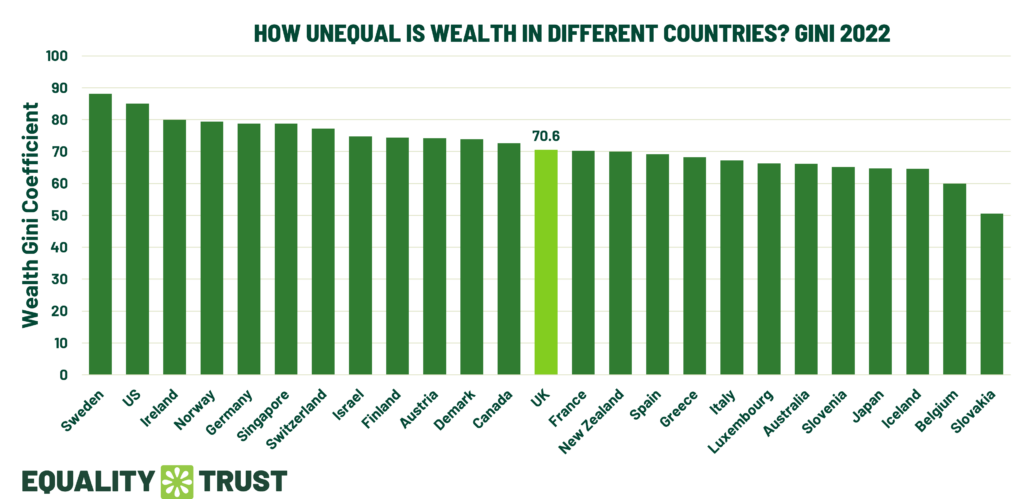
Source: Wealth Gini coefficient, Global Wealth Databook 2022, Credit Suisse
Over 50% of UK’s adult population has more than USD 97,169 wealth, as of 2018. With 2,849 dollar millionaires resident as of 2021, the UK is home to around 4.6% of all millionaires globally.8

Source: James Davies, Rodrigo Lluberas and Anthony Shorrocks, Credit Suisse Global Wealth Databook 2022
Compared to other developed countries the UK has a very unequal distribution of income, with a Gini coefficient of 0.351. The UK has one of the highest levels of income inequality in Europe, although it is less unequal than the United States.

Gini coefficient by country, 2021 or latest available, OECD
- Average household income, UK: financial year ending 2022, Office for National Statistics, 25 January 2023 ↩︎
- The effects of taxes and benefits on household income, disposable income estimate, Office for National Statistics, 25 January 2023 ↩︎
- World Inequality Database, 2022 ↩︎
- Institute for Fiscal Studies, Living standards, poverty, and inequality in the UK: 2021, 8 July 2021 ↩︎
- The effects of taxes and benefits on household income, disposable income estimate: 2018. Office for National Statistics, 26 February 2019 ↩︎
- What has happened to the income of retired households in the UK over the past 40 years? Office for National Statistics, 8 August 2017. ↩︎
- Household total wealth in Great Britain: April 2018 to March 2020, 7 January 2022 ↩︎
- The Global Wealth Report 2022, Credit Suisse ↩︎
Inequality in Your Inbox?
Get the news that matters direct to your inbox every week
by signing up for our newsletter
Join the fight against Inequality
We’re up against billionaires and the powerful. Being funded by supporters like you means we can stand up to them and demand equality.